Capturing 3D-DNA structure from compositions in diamond shape
Commentary on Forcato et al. "Comparison of computational methods for Hi-C data analysis", Nat Methods. 2017 Jul;14(7):679-685.
February 2018
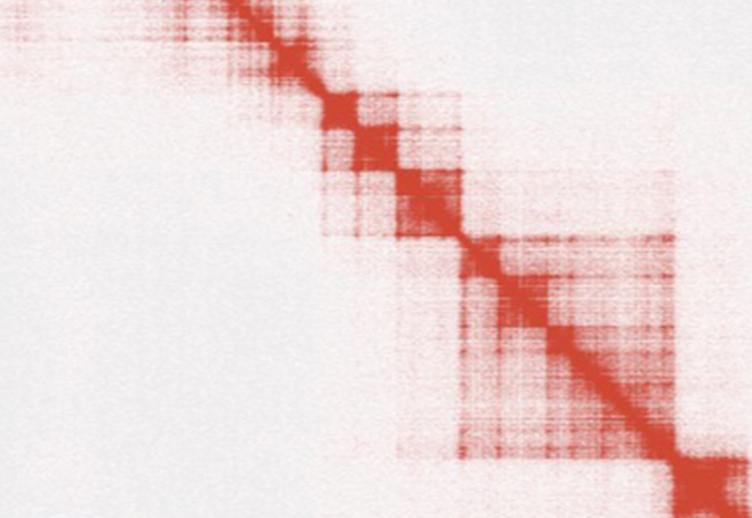
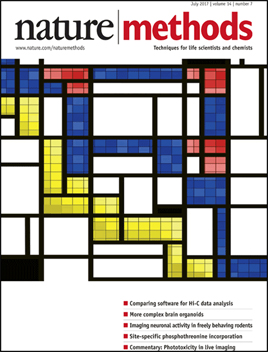
By the early 1920s, the Dutch artist Piet Mondrian started creating diamond-shaped paintings by rotating square canvases 45 degrees. In the diamond compositions, rectangular modules, enclosed by grid lines, are gathered into larger groups or clusters of modules that are delineated by lines of varying width and weight. The density of the clustering ranges from individual modules, which give the feeling of a constricted space, to groups of multiple modules, hinting to a more open and empty area. A century after Composition in Diamond Shape, Mondrian could have been be the inspired author of the lozenge grid-composition map that, in these days, scientists use to quantify genome-wide interactions detected from Hi-C data.
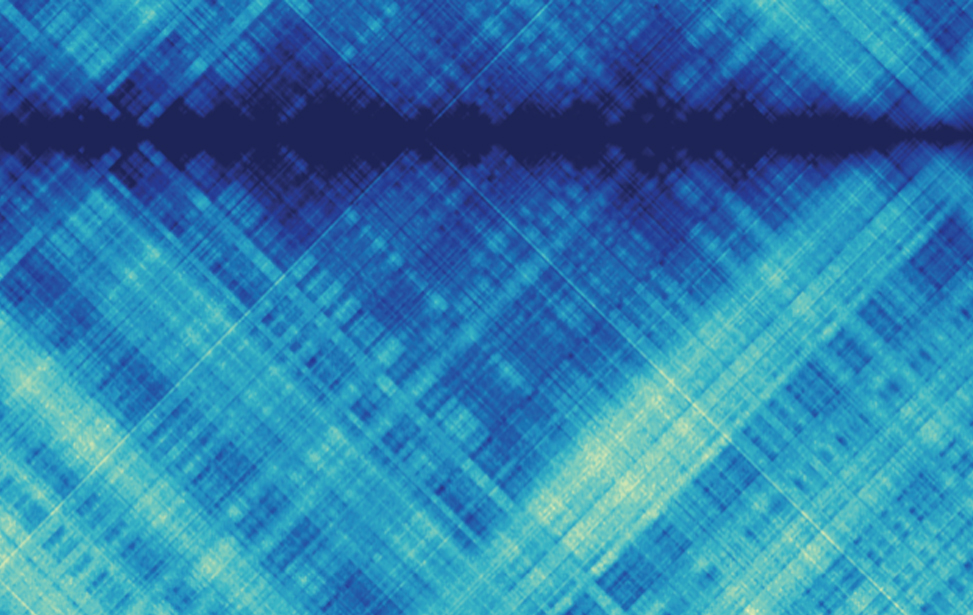
Hi-C is the latest of a set of experimental techniques based on chromosome conformation capture (3C1) that have been developed to probe the spatial organization of genomes and investigate how higher-order chromatin structures affect genome functionality. In Hi-C, the three-dimensional spatial proximity of potentially any pair of genomic loci is first traduced into biochemical events and then quantified as interaction frequencies using high-throughput sequencing. Hi-C read-out consists in hundreds of millions, or even billions, of read-pairs generated as the result of the ligation of pairs of DNA fragments that are close to each other in the three-dimensional genome space. These read-pairs are processed to generate the final result, i.e. a diamond-shaped, squared interaction map where each bin accounts for the number of contacts observed between two genomic regions as a proxy of their spatial adjacency.
Hi-C is a genome-wide sequencing technique used to investigate 3D chromatin conformation inside the nucleus. Computational methods are required to analyze Hi-C data and identify chromatin interactions and topologically associating domains (TADs) from genome-wide contact probability maps. We quantitatively compared the performance of 13 algorithms in their analyses of Hi-C data from six landmark studies and simulations. This comparison revealed differences in the performance of methods for chromatin interaction identification, but more comparable results for TAD detection between algorithms.
[PMID 28604721]
When my former post-docs Mattia Forcato and Francesco Ferrari first showed me an Hi-C contact matrix I found myself eye-scanning the picture collecting and measuring the weight of each rectangle to extract some underlying structures and relationships, as it was an abstract painting. At that time, they were both working in the lab of Peter Park at the Harvard Medical School in Boston on computational methods to efficiently analyze and interpret the enormous amount of genomic information contained in Hi-C interaction maps. The bioinformatics analysis of this data requires complex software pipelines that pre-process the sequence reads, generate and normalize the interaction maps, extract the patterns buried in the contact matrices, and finally associate signal intensities to different chromatin or chromosome structures. As in a Mondrian's painting, Hi-C contact maps manifest the presence of hierarchical patterns with different densities, reflecting chromatin or chromosome interactions at different scale lengths. The largest motifs are checkerboard-like sequential patterns of high and low interaction frequency, commonly associated to a bipartition of the genome in two sets of loci, named genomic compartments, characterized by enriched interactions within each set and depleted interactions between sets. The square patterns with distinct borders along the main diagonal are indicative of groups of genomic loci that tend to interact more with each other than with loci in other genomic regions and that, in metazoan genomes, are named Topologically Associating Domains (TADs). At a much finer scale, signal spikes account for local contact enrichments and may manifest the presence of point interactions e.g. between regulatory regions, as in the case of promoters and enhancers.
In the last few years, numerous algorithms have been developed to capture and extract these signal patterns and understanding the principles and usage of these computational tools is becoming increasingly important to support the interpretation of chromatin interaction maps2. Indeed, if on one side ultra-deep sequencing allows now producing high-resolution pictures of the 3D genome architecture, on the other the availability of reliable computational approaches for pattern identification and extraction is an essential prerequisite for capturing the actual, structural information encoded in the data.
The work of Forcato et al. builds on the methodological imperative to quantitatively assess how the various methods for the analysis of Hi-C data perform relative to one another and how the adoption of one computational strategy impacts the identification of chromatin structures. Specifically, they compared the performances of thirteen methods for the identification of topological domains and chromatin interactions from Hi-C data. Given the scarcity of validated empirical evidences for chromatin architecture to calculate comparison statistics, the study design is based on a quite impressive large set of experimental and simulated data that have been used to quantitatively estimate reproducibility, accuracy, and precision of the various methods. Surprisingly, the comparison evidences that no algorithm prevails the others in the precise identification of chromatin structures and that, irrespectively of the data resolution, the choice of the method severely influences the quantity and characteristics of the identified interactions. Algorithms for the identification of TADs appear to be more stable and reproducible than methods to call point interactions. In particular, the latter suffer of poor reproducibility, with few interactions detected in one sample conserved in other replicates of the same cell type. Although striking, this disappointing result may be partly ascribed to the characteristics of the analyzed samples that, being ensembles of cells in different states, are not necessarily identical in terms of chromatin contacts, as postulated in the study design. Despite their limited reproducibility, most detected interactions are of biological significance, as testified by the significant proportion of cis promoter-enhancer looping interactions and by the very small number of biologically improbable contacts. Finally, the set of results generated by this comparison constitutes a precious resource by itself, comprising an extensive summary of chromatin structures, as TADs and point interactions, in human embryonic stem cells, in fetal lung fibroblasts, in lymphoblastoid cell lines and in fruit fly embryos, that is currently available through Hi-C public data browsers.
Chromosome conformation capture-based techniques is already one of the most powerful tools to unveil not only the 3D genome architecture but also aberrations in chromatin organization that can eventually trigger events leading to genetic disorders and cancer. Ultimately, it is appealing to envision that these techniques might, in the near future, represent a centerpiece in the process to rationally identify genomic regions worthy of synthetic editing for biomedical applications. However, to uncover novel exciting aspects of the 3D genome architecture and of its dynamics, it is indispensable that researchers can count on rigorous and robust computational approaches to analyze DNA interaction data as algorithms may be efficient in discerning real structures, but equally so at extracting patterns when they are entirely absent. Similar to Mondrian's diamond compositions, where essential geometrical elements are instrumental to perceive an underlying structure in the world, the repertoire of patterns in interaction maps is instrumental to fully access the still secret essence of the DNA molecule, provided that we are confident in extracting the subtle relationships they encode.
References
- Dekker, J., Rippe, K., Dekker, M. & Kleckner, N. Capturing chromosome conformation. Science (80-. ). 295, 1306-1311 (2002).
- Ay, F. & Noble, W. S. Analysis methods for studying the 3D architecture of the genome. Genome Biol. 16, 183 (2015).


